Prometheus + Autuator
January 27, 2026
之前为了调用链分析,尝试了skywalking,发现配置不仅侵入性大,而且后台非常耗内存,至少4G起步(使用banyandb),所以暂时放弃,还是决定采用PLG做事后log分析吧(以后抽时间再写),至于实时观测,就采用了很流行的这个组合。
增加依赖
微服务端增加以下依赖
    api 'org.springframework.boot:spring-boot-starter-actuator'
    api 'io.micrometer:micrometer-registry-prometheus'
Docker配置
  monitor-prometheus:
    image: prom/prometheus:v2.50.0  # 建议使用 2026 年稳定的 LTS 版本
    container_name: monitor-prometheus
    <<: *default-log
    volumes:
      - ./prometheus/prometheus.yml:/etc/prometheus/prometheus.yml
      - ./prometheus/alert.rules.yml:/etc/prometheus/alert.rules.yml
      - prometheus-data:/prometheus
    command:
      - '--config.file=/etc/prometheus/prometheus.yml'
      - '--storage.tsdb.path=/prometheus'
      - '--web.console.libraries=/usr/share/prometheus/console_libraries'
      - '--web.console.templates=/usr/share/prometheus/consoles'
    ports:
      - "9090:9090"
这里面需要配置的就是prometheus.yml以及alert.rules.yml,可以参考以下例子
prometheus.yml
global:
  scrape_interval: 15s # 抓取频率,15秒是平衡性能与实时性的最佳选择
rule_files:
  - "/etc/prometheus/alert.rules.yml" # 这里的路径是容器内部的路径

scrape_configs:

  # 监控网关
  - job_name: 'crawler'
    metrics_path: '/actuator/prometheus'
    static_configs:
      - targets: ['crawler:8085']

  - job_name: 'core'
    metrics_path: '/actuator/prometheus'
    static_configs:
      - targets: ['core:8083']
alert.rules.yml
groups:
- name: service_status
rules:
- alert: ServiceDown
expr: up == 0
for: 1m
labels:
severity: critical
annotations:
summary: "服务 {{ $labels.job }} 离线"
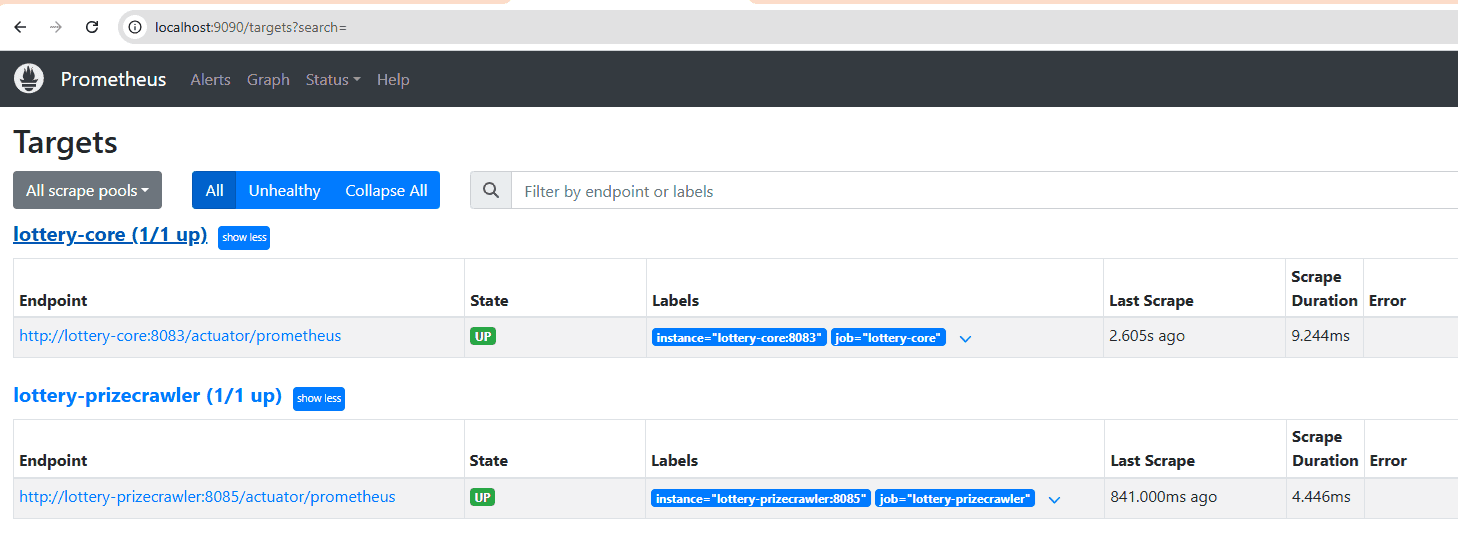
description: "微服务 {{ $labels.instance }} 已停止响应超过 1 分钟。"Prometheus UI
一旦启动成功后,就可以在Prometheus UI看到(Status -> Targets)运行状态
增加Grafana
如果你有好多微服务,自身UI就不太够了,需要连上Grafana来呈现所有微服务的启停状态
增加Nacos
同样微服务很多的情况下,全靠手工配置也不现实,最好是能从Nacos里面拉取服务并监控,配置如下。
scrape_configs:
 - job_name: 'nacos-discovery'
   metrics_path: '/actuator/prometheus'
   http_sd_configs:
     - url: 'http://nacos-server:8848/nacos/prometheus'
       refresh_interval: 30s
       # 必须添加鉴权信息
       basic_auth:
         username: 'nacos'
         password: 'nacos'
   relabel_configs:
     # 1. 正常的路径设置
     - target_label: __metrics_path__
       replacement: '/actuator/prometheus'

     # 自动从 Nacos 元数据中提取服务名,并赋值给标签 "service"  -- 生产时启用
     - source_labels: [ __meta_nacos_service_name ]
       target_label: service